September 30, '04. ..putting the swerve on...


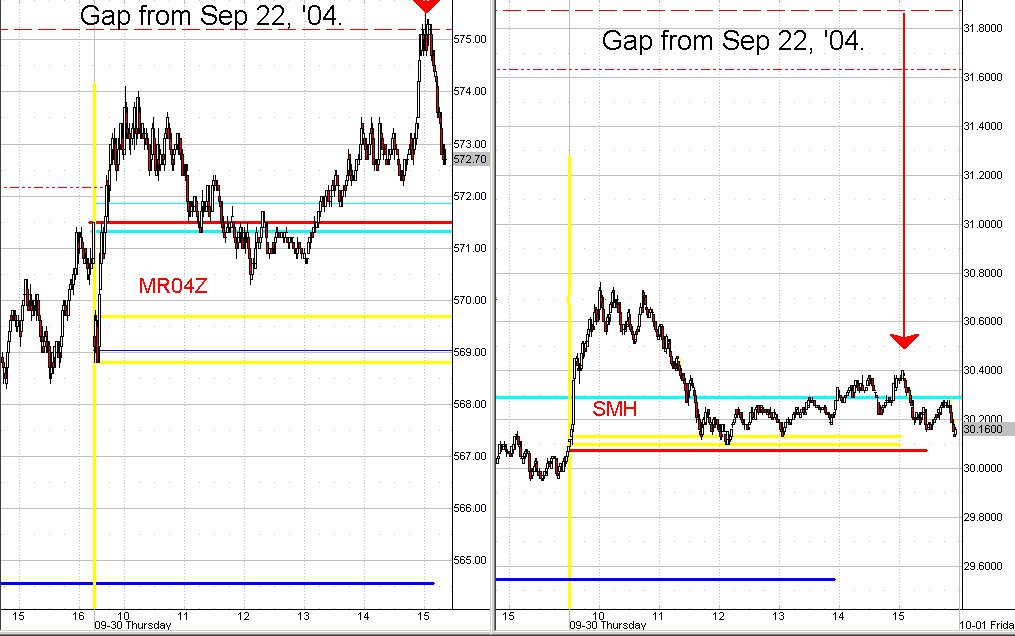
Thursday. That's what the SMH does when it's ready to move. It puts its swerve on. At ValhallaFutures, we use Event Concepts to define swing trade signals. And although the bulk of the work is focused on the shorter term intraday signals, an expanded version of the rules can be applied to the longer term end-of-day swing trades. Today, just such an Event Concept signaled an immiment turn for the weekly trend. The Russell 2k (symbol MR) filled a gap left open from Sep 22, the SMH displayced significant divergence, and furthermore displayed a topping pattern well-documented in the manual Pivots, Patterns and Self Recognition. A collision of pattern fruition and relative price. Come trade with us and learn the rules of these important signals. Check in at daytradersmethods.com.

September 28, '04. Be the trend...


Tuesday: Catching the early trend is the single most important focus of the day for floor traders. Nothing has more meaning and importance to their business. Some say that floor traders have an advantage over those working from their screens when trying discern early direction. They have noise, paper order flow coming into the pit, an immediate source of news and associated rumors, and an easily kept eye on the best traders around. But those of us trading off the floor from our screens have an advantage floor traders don't--if we would only learn to use it correctly. We have charts, and and a rule-based approach to go with them. What may seem like chaos to the inexperienced is like a piece of music when you learn the notes. The sell signal for today's downtrend was just such a sweet harmonic chord. How can all that pit noise compare!? Come join our trading room at daytradingmethods.com. Hear the music...be the trend.

September 27, '04. Today, you fill in the chart...


Monday. Most of the signals garnered from leadership mentioned in this blog are from the Opening and 1st Hour Time Period. Holding positions overnight is higher risk. And in the futures markets, protective stop-loss orders placed in the Night Session in anticipation of tomorrow's Opening outcome run the risk of not being executed at all. But sometimes the leadership of the SMH is like a road map of what will happen on the following day, and is worth the risk. For instance, scroll back a couple days to the previous post of Thursday, September 24. The subject was bifercation. The SMH was in an ABC upward correction while the Dow futures, the YM, was continuing its downtrend from the day before. Now study Friday's end-of-day chart above. Friday's YM was a Sequel to Thursday's SMH Prequel. But bifercation occurred again on Friday, signaling that most likely, the YM would follow the SMH right back down. If on Friday, at the end of the day, I had put up a blank chart for the YM, and asked you to take a position for Monday's Opening based on what you see in Friday's SMH, which way would you position your trade, long or short?

Join our chat room and get the advantage of having these signals in real-time, here at daytradingmethods.com

September 24, '04. No time to lose....


Friday. The first trade of the day usually has limited trend expectations, but it can often mean the difference between having a good trading day or not--but you only have seconds to make up your mind about it. And moreover, if multiple contracts are being used in a money management scheme to retain a partial position, then the first trade of the day can last the whole day. In any case, a decision to take one direction over the other in the first few minutes after the opening requires a clear and concise rule-based approach for immediate decision support. Take the course Pivots, Patterns and Self Recognition and learn why a buy signal occurred for the initial day's trend so quickly after the opening today. (Click to expand the chart above.)

September 23, '04. Can you say "Bifercation"?


Thursday. So it's bifercated....so what? No doubt you've heard this 25 cent word on a financial cable station before. It means the market direction is forked, one group going one direction, one in the opposite direction. Like today. The S&P exhibited good downside follow through to yesterday's selling, almost as a Sequel to yesterday's Prequel. The SMH, on the other hand correcting back upwards against yesterday's sharp thrust down. Moreover, you could see this taking shape in the first thirty minutes of trading. But so what? Knowking what kind of day model might be at hand can make or break you're whole trading day, that's what. Come to the chat room for Valhalla Futures and take the course that goes along with it. Learn why day modeling and their accompanying early warning signals can shape the way you trade.

September 22, '04. the Daytrader's mental decision environment...


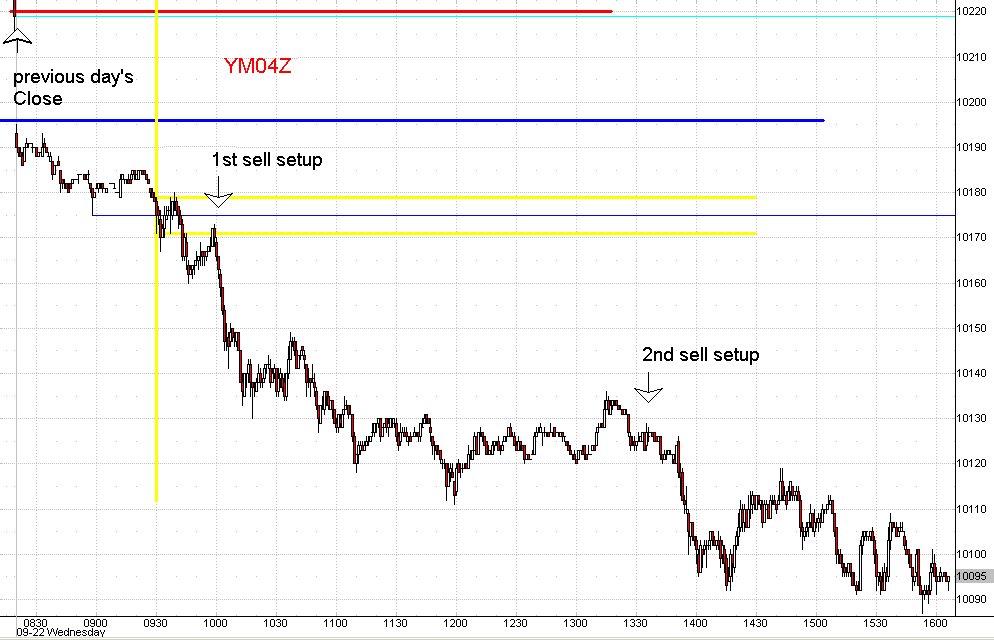
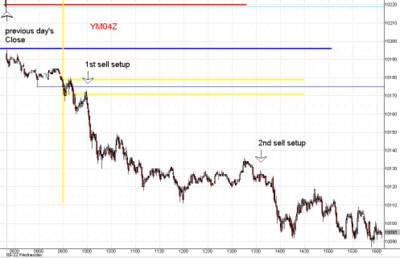
Wednesday. The psychological decision environment the trader faces each day is full of challenge. Many of these mental challenges are the same from day to day. Take the one wherein an opportunity to get on board a significant trend already seems to have slipped away before it is even recognized. Sound familiar? Very often, a daytrading trend of such significance will extend out over the entire day as a continuous trend day. On the face of it, such a day would seem to contain the best and easiest of profit opportunities, with hardly any hesitation or back pedalling throughout the day. And yet, how hard it is to quickly recognize and meet such a day with confidence in time enough to take best advantage with an early position in the right direction. Take today, for instance. Note the weekly market background description from which it sprang: more signs of growth in the economy, with yet higher stock prices pushing the psychological background into bullish euphoria. The pressure surrounding the trader not to be left behind is hard not to resist. And then the sharp gap down, catching everyone by surprise.

If you're still bullish into this gap down, the temptation to fade it for a recovery rally is strong. And if you've seen it correctly as a long awaited correction, price is already so far below the previous day's closings that the opening seems almost to far gone to participate. So what do you do? You might choose to wait for higher prices and end up missing out on the bearish trend altogether; you might try to get even with the market for doing this to you by going against the trend, trying to pick the top or bottom; or place only tentative sell orders along the way that get shaken out quickly by counter trend bull spikes until you throw your hands up in disgust at the day in exhaustion. It is only at the end of the day, looking back over it that the correct strategy now seems so simple: get in early and out via a market-on-close order.

Take the course Pivots, Patterns and Self Recognition and learn the signals that would have gotten you short on this day shortly after the opening and then again before the big break down later in the day. A better mental decision environment awaits you...

August 24, '04. A Texas Two-Step


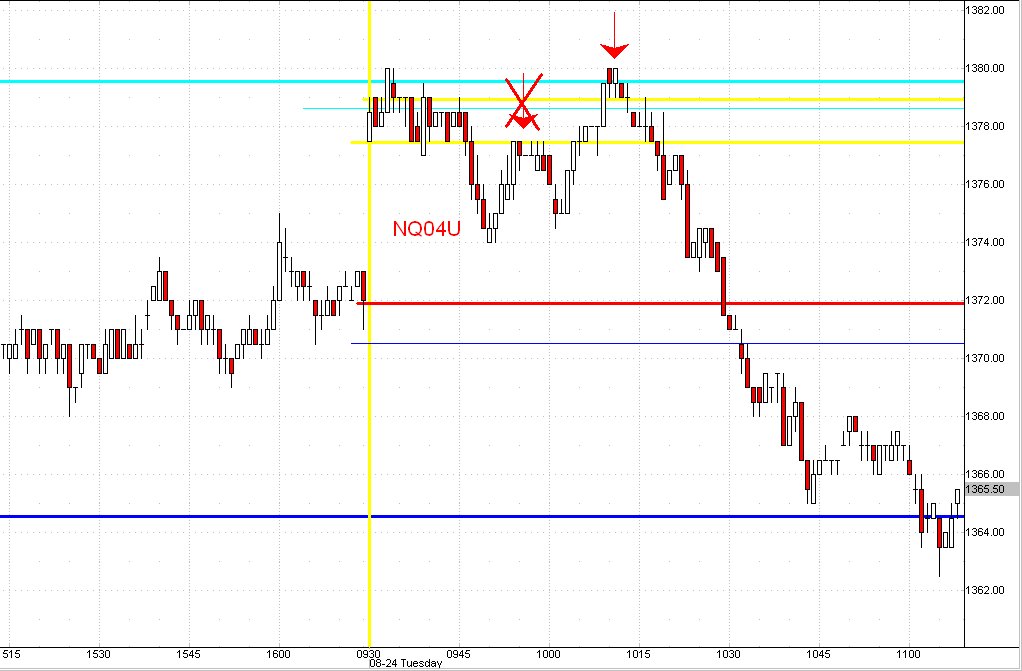
The hesitation dance step price displays before uncovering a tradeable trend is usually a confusing trick to learn--and a costly one for traders. Study the chart above (click to enlarge). Using the methodology from Pivots, Patterns and Self Recognition, there were specific rules that would have kept you out of shorting the NQ index at the first red down-arrow, and accompanying rules to get you into the short at the second and higher red arrow. If your techiques didn't position you correctly in the short NQ trade this morning, then perhaps you should consider taking our intraday swing trading course from daytradingmethods.com.

August 23, '04. Split Openings can split capital...


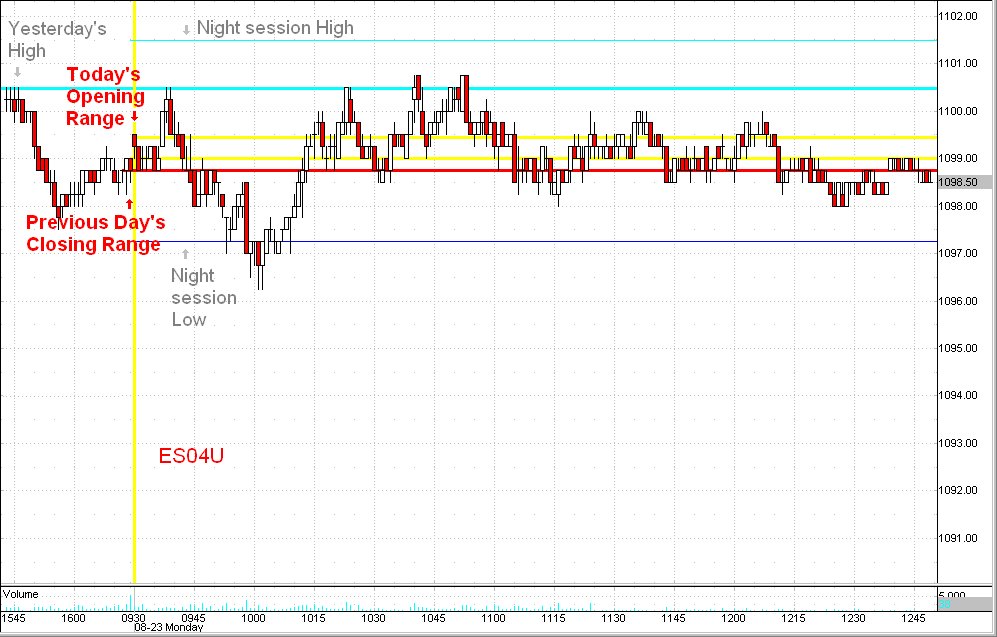
A lot of costly and frustrating trades can take place in a directionless market. Grant Noble, in his book The Trader's Edge, talks about the Split Opening in the grain pits as one wherein the opening price of the day is within the prior day's closing range. This often suggests that the market is in temporary balance and directionless action will follow. The same can apply to the stock index contracts, with some notable variations. Today's open just touched yesterday's closing range, and narrow action proceeded to follow well into the time of this writing at 3pm ET. The specific variations of this signal best reserved for the stock index contracts are discussed in the training course Pivots, Patterns and Self Recognition. Take the course and learn these and other capital-saving tips from daytradingmethods.com.

August 20, '04. Start the day right...


Your first trade of the day can have an encouraging or debilitating affect on the rest of your trading day. Identifying this initial trade is often very tricky. What is a trend to get on, and what is a trend about to reverse? Will the gap close, or will the price action fail? Study the chart above (click to enlarge). If your present trade methods didn't give three signals to bet short at the highs and two key signals to cover and go long at the lows, then consider taking the course Pivots, Patterns and Self Recognition. The ValhallaFutures methodologies identified these signals, and you can learn them too.

August 18, '04. ..the Measured Move...


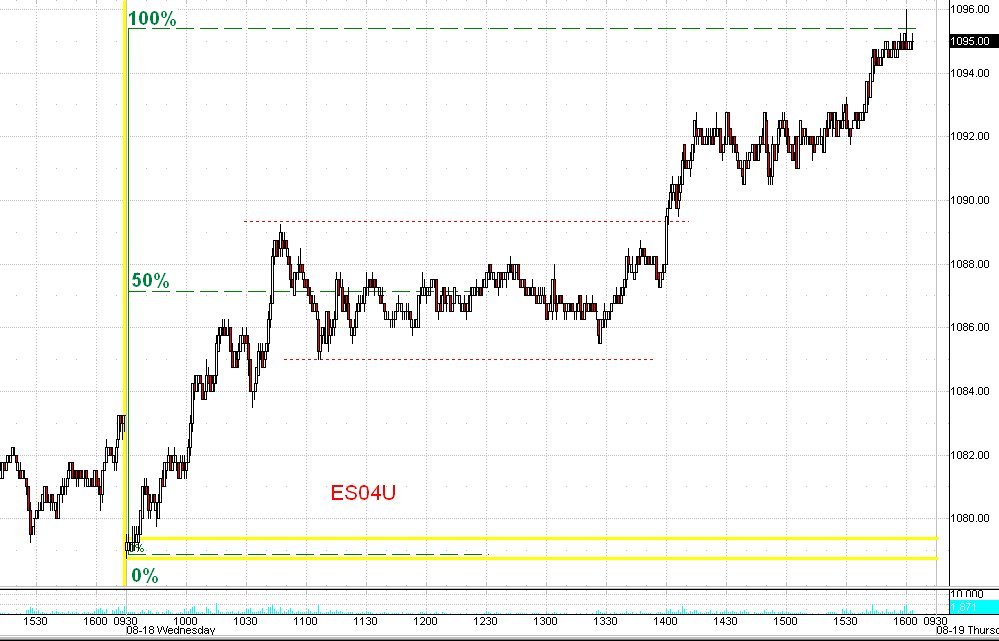
One of the least understood and under-utilized daytrade patterns in the index futures contracts is the MidDay Channel. Conveniently written off from consideration the amorphous form of the midday doldrums, this pattern is packed with an equal move in the original trend direction if you know how it's proscribed and triggered. Measuring half way between the day's high and low, the MidDay Channel can often provide a second chance at capturing a piece of the day's original trend missed by the speed of the earlier move. To learn its elements and to recognize its format, come study the intraday swing trading course Pivots, Patterns and Self Recognition.

August 16, '04. the Technical Event Concept


There are three components that should be present for a Technical Event Concept: price level, time-of-day, and pattern fruition. When all three of these come together a tradeable swing signal is almost always at hand. On Monday, August 16, '04, all three came together nicely to call the end of one swing trend and the beginning of another. Take the course Pivots, Patterns, and Self Recognition and learn to recognize an Event Concept in time to position for intraday swing trades in the futures markets like these.

August 6, '04. Sequel...the big one that did not get away...


Sometimes trading is like fishing the day after the big one got away. First, you have to show up again. And second, you have to know what you're looking for. And if you kept one eye on the large triangle that was forming all morning today, like an eye to where the fish were biting yesterday, you just might have hooked the Sequel to yesterday's big diving fish. Learn the Prequel-Sequel and the rules to trading triangles in Pivots, Patterns and Self Recognition, available soon through daytradingmethods.com.

August 5, '04. The kiss of death...


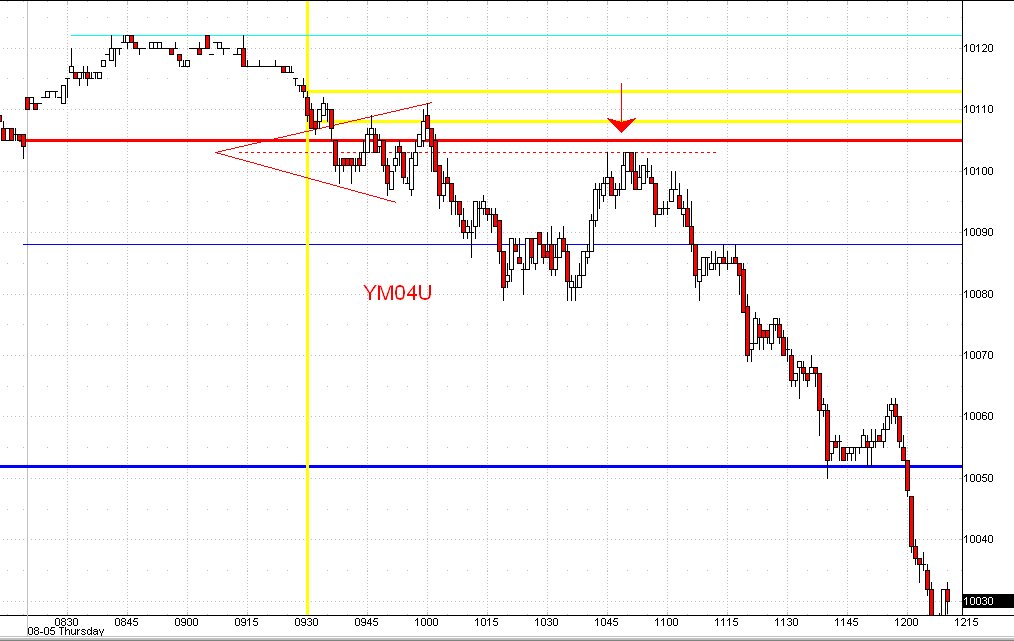
The apex of a triangle can provide one of the best trade opportunities on the board. But few traders bother to contruct the apex on expanding triangles, also referred to as reverse symmetrical. (Click to study the chart above.) How price action reacts to a kiss of the apex can uncover the direction for the next significant trend. There are over 12 different trade setups regarding triangles in the course Pivots, Patterns and Self Recognition. Check it out at daytradingmethods.com.

August 4, '04. From the Mayoral campaign: "...and we'll even fix the potholes..."


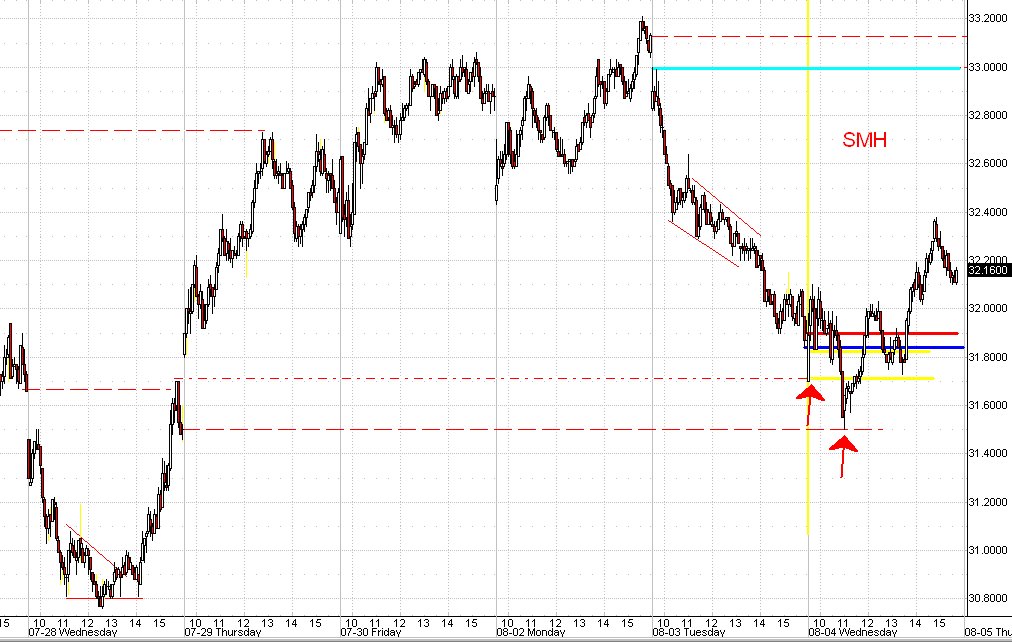
And so does market action fix its price holes, even if it misses a few. A intraday swing trader can't afford to ignore the gapping price holes left on the bar charts, no matter newly created or long ignored. Click on the chart above to study today's action closely against that of a week ago. Price opened today filling the air space left from the week old gap, and then sold off again to close the gap completely, before an even sharper price reversal. Knowing where these price holes are each trading day is like having a road map around the downtown D.C. street terrain. Ignore them at your peril. Part of the training course for Pivots, Patterns and Self Recognition is a live, graphic chat room where these price holes are discussed each day. Come join us. Driving school is open.

August 3, '04. The right tools for the right job...


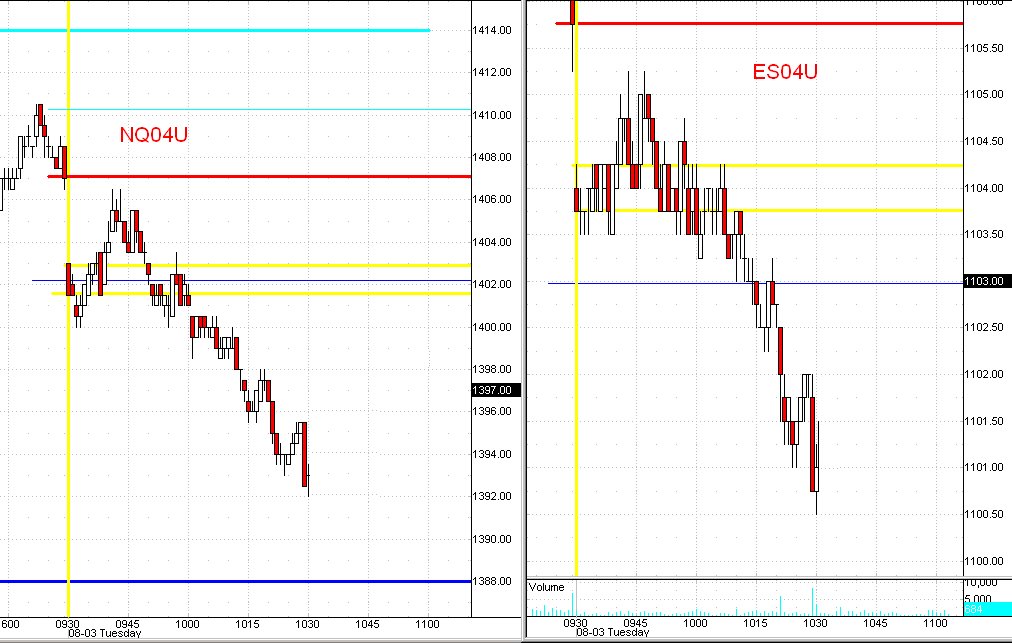
The day's first swing trend is often difficult to discern. Once that direction seems committed, traders rush to the small retracements to position for further continuance. But alas, often by the time a trend is uncovered, it's already come to an end, and for the intraday swing trader, a new one has already begun. There were two signals in the above charts that telegraphed to the observant trader that the initial bear trend exposed after the opening had,in fact, come to an end (click to enlarge). And not a single oscillator is necessary to see it. If you're trading kit doesn't have these two tools in it, then perhaps you should consider taking the course Pivots, Patterns and Self Recognition from ValhallaFutures, available at daytradingmethods.com.

August 2, '04. "What we have here is...a failure...to...communicate."


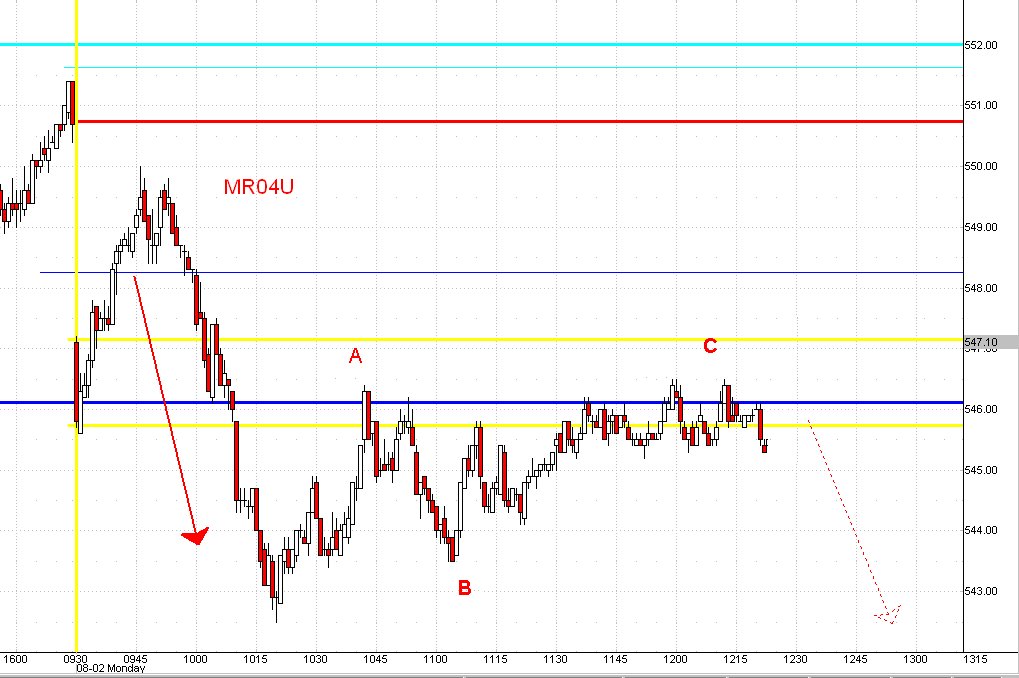
The outcome of a MidDay Period consolidation pattern is often the result of anticipation failure. This is the way the market works. It could not be otherwise so. All morning of Monday, August 1, the atmosphere surrounding the market was dripping with fear and loathing, communicating lower prices dead ahead. Police surrounding fresh terrorist targets in New York and D.C., a gap down opening bell in all indices and media talking heads reminding us of stock market reactions to past terrorist activities. Indeed, even the charts seem to be cooperating as corrections to the morning sell-offs seem only to be ready to collapse into selling again. And yet...by the end of the day the market was not selling off from the point indicated in the chart above labelled "C". Price eventually rallied sharply and finished higher after reaching the highs of the previous day. Study the concept of pattern failure in the training course Pivots, Patterns and Self Recognition, and learn to spot the true under currents to price with two little known patterns called the Dough Bar and the Fail Trigger. (The quote, in case you didn't recognize it, is from Cool Hand Luke.)

July 30, '04. Prequel-golf.


Market behavior has a tendency to repeat itself in two consequetive days, one a Prequel to the next day's Sequel. Click on the graph above and you can study the the 1st Hour action on the morning of Thursday, July 29, against the same period of the following day, Friday, the 30th. By the time the day was finally over, the trend was no better established or potentially profitable on the day of the Sequel than it had been on the day of the Prequel. The similar opening pattern of the 2nd day indicated a Sequel pattern was in play. It was a strong indication that the fairways and smooth greens of your local golf course might be a better way to spend the day.

July 29, '04. ...and the decision is....Split!


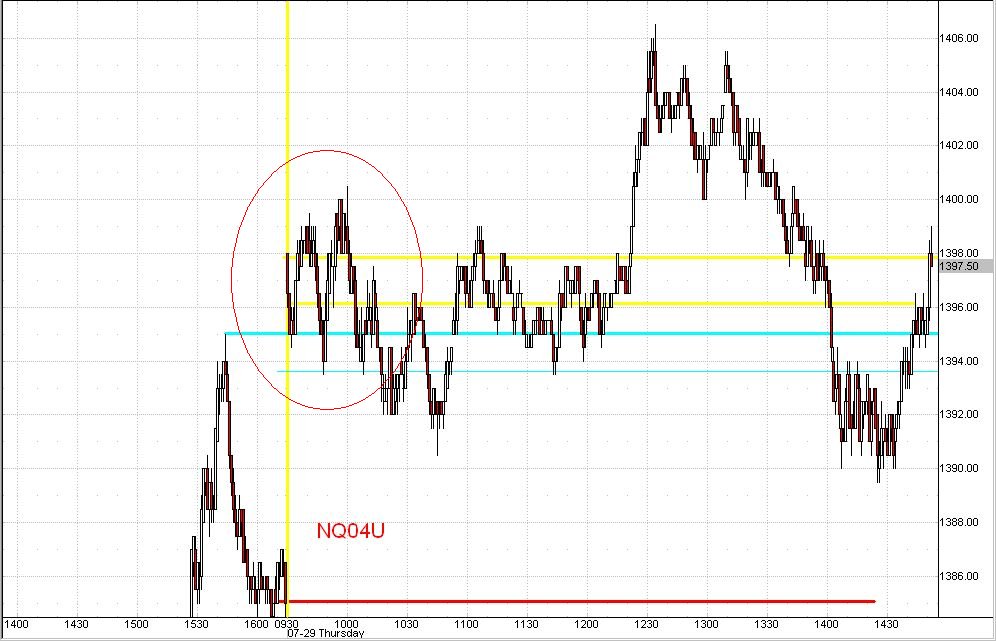
The market often gives early tell-tale signs where it intends to go for the rest of the day. Likewise, the market sometimes indicates quickly after the opening that there is no significant trend at hand at all. Thursday, July 29, was just such a day. Knowing this in advance of the day can save the trader considerable frustration and a lot of precious capitol. Study these and the other day-model identities in the course Pivots, Patterns and Self Recognition.

July 28, '04. ...back to Jump Ball...


A better example of the Jump Ball opening could not be found than today's early price action. After tossing the ball up for grabs, it quickly came back down into play below the opening price. Then one of the several favored Test-and-Reject setups from the training manual was employed to capture the accelerating down trend. Take the course and learn the tricks in Pivots, Patterns and Self-Recognition.

July 27, '04. The first rule of divergence is...


One of the key and most often ignore aspects of divergence is established leadership. If an index is lagging the day's trend, it will naturally be diverging from other indices at every temporary turn. Trading on such divergences will usually produce losing trades, or at best winning scalps. Since we are looking for intraday swing signals, we first note which index is leading, and then watch it for divergence against the trend in which it led. Today was just such a day. It was the SMH that was leading the market down dramatically all morning. But when the ES contract finally followed suit to make a new intraday low, the SMH was already turning back up against the trend. Having led price down, it was now meaningful when it began leading it back up. Study all the forms of special divergence and intraday swing signals in the manual Pivots, Patterns and Self Recognition.