June 29, 04. Take what the market offers, or....


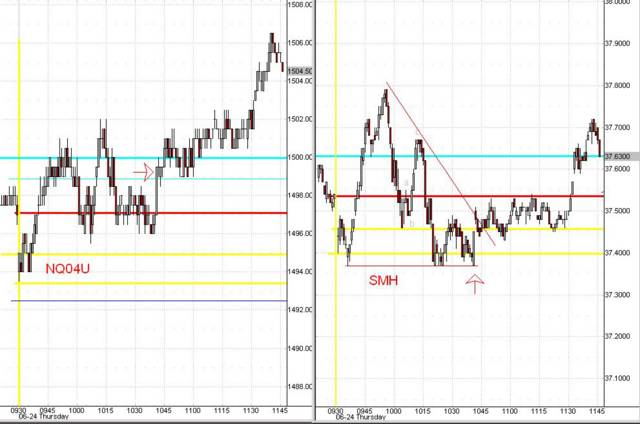
Take what the market offers you, or trade the Russell 2k Index. Since the Semiconductor Holder SMH doesn't have a futures contract--yet, we transfer signals observed there onto other index contracts. But sometimes trading ranges are narrow and offer little opportunity, like today in the ES and NQ contracts. But if you were keeping an eye on the more volatile mini-Russell 2000 Index, symbol MR or ER2, today's offering wasn't too shabby. First, a pair of Opening directional signals between the SMH and ER2, the Re-ORB and the Range High/Low Opening, were good for about 5 pts in the mini-Russell. A smaller profit was offered near a Noon Hour High at a trendline break in the mini-Russell, after a pair of MidDay Triangles signaled a reversal in the SMH. This short trade was good for about 2 pts if held to the Last Hour Transition Time. The SMH then signaled a reversal swing back to the long side, but there were no clear patterns nor sufficient volatility left in any of the indices to warrant a position. If you want to learn more about these and other intraday index swing signals, join our trainging group for Pivots, Patterns and Self Recognition, available at daytradingmethods.com (click image to enlarge)

June 28, 04. The Last Triangle...


(Mon, June 28) Price gapped up higher and held its bullish bias all morning and well into the MidDay Time Period after forming a Split-Opening Triangle in the mini-Dow. This tell-tail triangle, which often accompanies the end of a swing, gave two important signs that the impending bullish breakout would not succeed. (See the manual Pivots, Patterns and Self Recognition for details). Then, just before the sharp and very profitable break to the downside, price action set up a very clean Fail Trigger Signal for a short-sale position. The trade was good for 100 points in the mini-Dow, 10 in the ES and 15 in the NQ contracts. (click image to enlarge)

June 25, 04. Prequel-Sequel...


A range high opening in the SMH gave comfort for taking a gap-close long position at the opening of the day. The swing up into the 1st Hour Transition Time was good for 11 pts in the NQ, 4.5 in the ES and 30 in the mini-Dow. But the exit signal to stop-n-reverse was far clearer than the opening long trade. A topping triangle pattern in the ES was a Sequel to an identical pattern in the NQ from the day before (see post from June 24, below). From there, the trend was down for the rest of day, pausing for a pair of consolidasting channels along the way. The short was good in the ES for 8 pts, and some 60 pts in the mini-Dow. But if you traded the ER2 or the Nasday, and you didn't leave for that Friday pm golf game at the Last Hour Transition Time, your short position didn't pay off at all. A bifurcated market ended the day with a sharp rally in the NQ while the Dow and ES kept selling--not occurence to be witnessed often--suggesting the larger trend rally has not come to an end just yet. (click image to enlarge)

June 24, '04. What goes up....


After an early bear scalp off a Shoulder abc formation, the first real swing signal was about to appear. The signal was given by the SMH as it formed a Right Angle Declining Triangle that failed to break out at all, forming a Williams Squat reversal, right at the 1st Hour Transition Time. A Dough Bar confirmed the trend change. Too bad they don't trade futures on the SMH yet, but I'm informed it's coming soon! So the trade was taken in the NQ, the SMH's closet futures cousin, and was good for some 6 pts before hitting a series of opposing topping signals.

June 24, '04. (cont'd) ....can also swing back down.


As the Noon Hour approached, a rare appearance of complimentary triangle reversal signals formed in the ES and NQ contracts. A fail trigger gave a second opportunity for trade entry, and the sell-off was on its way. The short was good for 4 pts in the ES, 8 in the NQ. To their credit, two good traders from the #emini chat channel caught this high with timely shorts using their oscillator divergence methods. But neither one stayed the course for more than a scalp's worth of profit.

But there are even bigger fish to fry from today's action than today's intraday trades. On the 60-min charts, a Two Frame Divergence appeared between the mini-Dow and the SMH. Although several of these have not yet produced a final high for this rally, this one is adding to the weight that the time is drawing near for a reversal of trend in the daily time frame.
(click image to enlarge)

June 23, '04 Signal even better late than never...


The real low of the day came early, but too late to be recognized in the 1st Hour Transition time as a valid signal. But not to worry, traders missed little as the muddy signal around the low would have produced little if any real profit in all but the NQ. But when the narrow range-bound trade continued on into and throughout the entire MidDay Time Period, and succeeded in wearing out most of the traders who frequent the FinancialChat and Othernet channels, it was--by its own delay--a sign that a breakout was soon to arrive. The hard evidence that a real breakout was finally at hand was visible in an Event Concept by the NQ. A MidDay Channel, complete with its customary false breakouts in both directions, met fruition with an abc trigger at the Last Hour Transition Time. The trade was worth 10 pts in the ES, 15 in the NQ or 90 in the mini-Dow. Other pertinent observations: Both the XBD.X and the Dow Jones Transport had indicated earlier in the day that the breakout would likely be to the upside. (click image to enlarge)