July 30, '04. Prequel-golf.


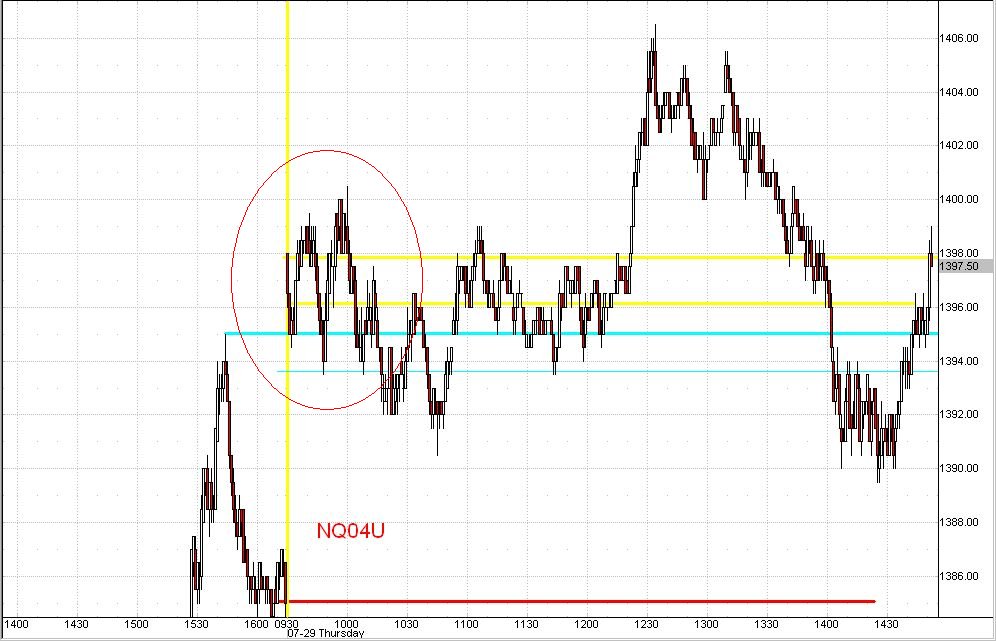
Market behavior has a tendency to repeat itself in two consequetive days, one a Prequel to the next day's Sequel. Click on the graph above and you can study the the 1st Hour action on the morning of Thursday, July 29, against the same period of the following day, Friday, the 30th. By the time the day was finally over, the trend was no better established or potentially profitable on the day of the Sequel than it had been on the day of the Prequel. The similar opening pattern of the 2nd day indicated a Sequel pattern was in play. It was a strong indication that the fairways and smooth greens of your local golf course might be a better way to spend the day.

July 29, '04. ...and the decision is....Split!


The market often gives early tell-tale signs where it intends to go for the rest of the day. Likewise, the market sometimes indicates quickly after the opening that there is no significant trend at hand at all. Thursday, July 29, was just such a day. Knowing this in advance of the day can save the trader considerable frustration and a lot of precious capitol. Study these and the other day-model identities in the course Pivots, Patterns and Self Recognition.

July 28, '04. ...back to Jump Ball...


A better example of the Jump Ball opening could not be found than today's early price action. After tossing the ball up for grabs, it quickly came back down into play below the opening price. Then one of the several favored Test-and-Reject setups from the training manual was employed to capture the accelerating down trend. Take the course and learn the tricks in Pivots, Patterns and Self-Recognition.

July 27, '04. The first rule of divergence is...


One of the key and most often ignore aspects of divergence is established leadership. If an index is lagging the day's trend, it will naturally be diverging from other indices at every temporary turn. Trading on such divergences will usually produce losing trades, or at best winning scalps. Since we are looking for intraday swing signals, we first note which index is leading, and then watch it for divergence against the trend in which it led. Today was just such a day. It was the SMH that was leading the market down dramatically all morning. But when the ES contract finally followed suit to make a new intraday low, the SMH was already turning back up against the trend. Having led price down, it was now meaningful when it began leading it back up. Study all the forms of special divergence and intraday swing signals in the manual Pivots, Patterns and Self Recognition.

July 26, '04. Jump Ball...


Any day's price action can be broken down into one of three general day models. Each of these three day types have their own trade setups that offer better chances for profits. The faster a trader can identify the type of day most likely at hand, the better chance he has of choosing which set of setup strategies are most likely to succeed.

One of these day types is the Test-and-Reject. On this day type, price often starts off quickly in one direction, is immediately rejected, and then turns and comes back to opening levels. A bearish Test-and-Reject day starts off like a basketball game where the Jump Ball sends the price straight up. But once tipped, the ball quickly falls back down into play. Today's action was just such a Jump Ball, giving an early signal that any price pushes above the opening would not be greeted favorably. Study all three types of day models in the course Pivots, Patterns and Self Recognition, and learn to recognize the best setup models that go with them before quickly, before the day's best opportunities slip away.

July 23, '04. Tape reading is in the charts...


After yesterday's midday reversal, there was much anticipation for a follow through today. Thus, a gap down opening was seen as a favorable buy opportunity for many traders. But ValhallaFutures saw three elements that signalled the gap would not close with an initial rally. The third signal was also a setup to sell short. This signal was good for 4 pts in the ES, 10 in the NQ, and 50 in the YM (mini-Dow). Learn to identify these signals right at the moment they occur, in the training course from ValhallaFutures called Pivots, Patterns and Self Recognition.

July 22, '04. Divergence convergence...


Yesterday, the Semi-conductor Holders, SMH, gave a series of non-confirmations to the successive highs made by the S&P, symbol ES. That triggered a steep sell-off lasting the rest of the day. Today, the SMH did it again, but this time in the other direction, failing to confirm a series of new lows made by the ES. Coupled with two other critical elements of an Event Concept, this Serial Divergence put the finishing touches on a setup worth 14 large in the mini-S&P and nearly 120 in the mini-Dow. Study Serial Divergence, and two other noteworthy types of divergence called Two-Frame Divergence and SPeed Divergence in the course Pivots, Patterns and Self Recognition.

July 21, '04. "Attention KMart shoppers..."


Unlike retail merchandise, there is seldom any value found in marked-down stock index goods when a bullish trend is indicated. Contrary to your emotions, the best buy is almost always the more expensive one, and is also the one giving you the least opportunity to get in. Today's early trade opportunity was just such an example. The SMH kicked off the opening with the largest gap up of all the indices, but when it came to marking down price, the mini-Dow showed itself the most reluctant. While the SMH was busy selling off to close it's gap, the YM was unable to even get below it's opening price. Which one was the better buy at their respective support points? The better judgement was proven by the resulting reaction. Clearly the one showing the least discount was the better buy. But you'll never hear that coming across the intercom while shopping the isles of your favorite discount store. Study the attributes of leadership and relative strength in the manual Pivots, Patterns and Self Recognition.

July 20, '04. A Greenspan morning meander...


On an anticipated day of Federal Reserve testimony before Congress by Chairman Greenspan, trends are usually delayed until the end of the day. But two-sided trading can have its profitable if humble opportunities. Today's simple double top provided a short-sale signal worth 2 pts in the ES contract and 25 in the YM (mini-Dow) to close their respective gaps. Learn a special divergence trick to identify a double top or bottom just as it occurs, in the training course Pivots, Patterns and Self Recognition.

July 19, '04. Turns at the scene of the crime...


A Pivot Ledge is left on the charts whenever price action breaks sharply away from a consolidation pattern. This price point often has a magnetic affect on future price action, even if well into the future. After a Triangle Pair Signal near the Noon Hour Low in the mini-Dow today, price reached just such a Pivot Ledge in this morning's sell-off in the mini-S&P, (ES). Valhalla Futures is still in this position as the time of this posting, but a return to the Opening Range as target would produce a 6 pt profit in the ES and 70 pts in the YM (mini-Dow). Study the rules of this market phenom and dozens of others in the manual Pivots, Patterns and Self Recognition.


July 16, '04. SOX is not a cat from the Clinton Whitehouse...


...This Sox is still on the scene everyday and still leading the way with its footsteps. SMH, the equity holding instrument for a basket of semiconductor stocks that the SOX index tracks, was certaintly at the forefront of the technology bubble in the '90's. But unlike the since-watered-down NQ, it's still leading the way in the markets. Keep an eye on this vehicle during the trading day as a cue for direction and trade setup. With the Range High/Low Opening Signal and early downside leadership shown by the SMH this morning, an early sell setup in the ES was worth a quick 6 pts, 12 pts in the NQ and about 50 in the mini-Dow (YM). Study the rules for the 1st hour trade setups in the training course from ValhallaFutures, found today through futurestrade.com. (click image to enlarge)


July 15, '04. Deja Vu all over again...


The Sequel to a Prequel can occur at any time, but none so unexpectedly as the opening patterns. Today's complimentary triangle reversal patterns matched yesterday's Noon Hour High very nicely, except that they appeared minutes after the opening bell. The best way to prepare for a possible Sequel is simply review yesterday's patterns before the opening bell. Study other examples of the Prequel-Sequel phenom in the manual Pivots, Patterns and Self Recognition, available from daytradingmethods.com.(click image to enlarge)

July 14, '04. Location, location, location...


The key to identifying today's top was not only in the complimentary pair of triangle reversal patterns appearing near the Noon Hour High, it was WHERE these two triangles made their appearance that cemented this setup as an Event Concept. In the mini-Dow, symbol YM, price reached its climax by closing a gap from some 10 days earlier. A 50% retracement back down from the morning's early rally was worth 40 points in the YM at the triangle's break. Learn the all the elements of an Event Concept to identify swing trade opportunities in the training course from ValhallaFutures at futurestrade.com.(click image to enlarge)

July 12, '04. ...old time gaps be not forgotten...


Many traders focus on the morning's gap exclusively and foolishly forget about previous day's unfilled gaps today. These old unfilled gap can be the most significant points of support/resistance of the day, and more, price has a tendency to be called back to these gaps as if unfinished business was awaiting before further trend resolution can unfold. In the 60-min chart above for the Russell 2000, symbol MR04U or ER2, price signaled a trend reversal after an initial decline from a unfilled gap nearly a month old, from June 15th. Along with the other elements of the signal, the trade was worth nearly 7 points. Learn the rules for marking unfilled gaps in the training course from valhallafutures. (The complete quote "Way back yonder on the charts of cotton, old time gaps be not forgotten" is a witicism from Randolph Newman, a floor trader from the former New Orleans Cotton Exchange and mentor to the author as a young man.)

July 9, '04. The most important price level of the day...


The Opening Range is for professional floor traders perhaps the most important price level of the day--or at least for the 1st Hour action. The quality and type of chart action as the market retraces to this price level often provides the best trade signals of the morning session. Study the setup categories involving the Opening Range as provided in the training course from ValhallaFutures. (click image to enlarge)

July 8, '04. Let them build it; a trade will come.


Caution: patience is required for successful trading. Resist the temptation to take trades outside of your setup universe. And today's opening hour was just such a temtation. Squint your eyes on the chart above in the section that precedes the trade entry arrow. You should be able to see a large W, a classic bottom formation, one of about 5 that occur commonly in the opening hour when trading begins with tiring consolidation instead of an immediate trend. A pattern once formed is once recognized. A convenient zigzag was then ideal for an entry, marked with the red arrow. The trade was worth some 25 points in the mini Dow and about 3.5 in the ES at the gap closing exit signal. Read about this and other formations under the type-of-day category called a Test-and-Reject, in the manual Pivots, Patterns and Self-Recognition.(click image to enlarge)

July 7, '04. Gap Close Reversal


Yesterday, after a gap down, the trend continued lower without ever closing that gap. Today on a gap down, the market reversed, closed the gap and continued higher. But how would you know? The clue today was the Range High/Low Opening Signal occurring in the Nasdaq futures contract. The trade was good for 8 pts in the NQ with the Work-Done exit signal occuring at the Overnight High. Learn to recognize and use these powerful entry and exit signals in the training course Pivots, Patterns and Self Recognition.(click image to enlarge)

July 6, '04. Gap-n-go.


One of the more dependable opening trades of the day is betting that the gap will close on any given security or contract just after the opening bell. The problem is, often it doesn't. While traders kept their eyes on the potential gap-closing this morning, the three critical elements of a Technical Event Concept came together for a short signal in a continued trend down. These three elements are time, price level and pattern. Today's Event Trigger was good for 6 pts in the ES and 12 in the NQ. Learn to identify the specific elements of any Event Concept in the trading course from Valhalla Futures and your skills for knowing which way to trade a gap will increase dramatically.

July 2, '04. Pre-holiday Friday. Trade early, play golf...


And that might be good advice for any Friday, which tends to be less volatile in the afternoons than most. Trade early, break for the remainder of the day. And as if to accommodate our afternoon vacation plans today, the ES contract exhibited a bullish SPeed Divergence signal early in the session after taking out the Overnight Low. The long trade was good for 4 pts in the ES contract and about 40 in the mini Dow (YM). Look for the rules for a Pattern-to-Numbers setup in the manual Pivots, Patterns and Self Recognition. Then enjoy your afternoon, and all the best to you on our great country's 4th of July!!(click image to enlarge)

July 1, '04. Opening signals require immediate action...


A pair of Range High/Low Opening signals in the NQ and the SMH tipped the scales right from the get-go that a bearish trending day was at hand. But since these two instruments seemed already too far advanced to get in on a position, the Trader would most likely have looked elsewhere for a setup. And it was easily found in the mini-Dow, symbol YM and the mini-Russell, symbol MR. A pair of triangle tops in a Test-and-Reject formation pleaded for recognition in the first few minutes of the day, while the NQ and SMH were virtually collapsing. The breaks were worth about 8 pts in the MR and at least 100 in the YM before any bounce of merit registered on the charts at all. Study the 1st Hour Time Period setups from Pivots, Patterns and Self Recognition for these and other setup signals.(click image to enlarge)

June 30, '04. Trade an FOMC rate change with the Probe pattern...


Like a game of baseball, trading on the day of an FOMC interest rate announcement can require patience, then suddenly all hell breaks lose. Many traders lose money positioining trades around news announcements. But using the rules of the Probe pattern can reap great rewards with very limited risk. The pattern appeared after the FOMC announcement today in every mini-index contract, offering about 8 pts potential in the ES, 10 in the NQ and about 50 in the mini-Dow. The rules for this trade pattern and all those found in this blog can be found in the trading course Pivots, Patterns and Self Recognition. (click image to enlarge)