August 24, '04. A Texas Two-Step


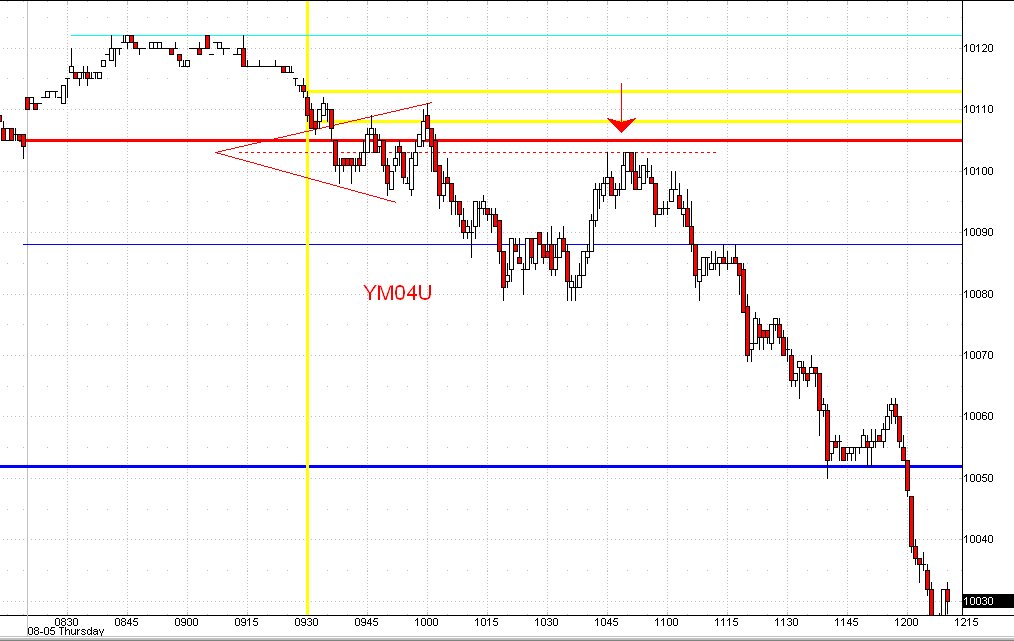
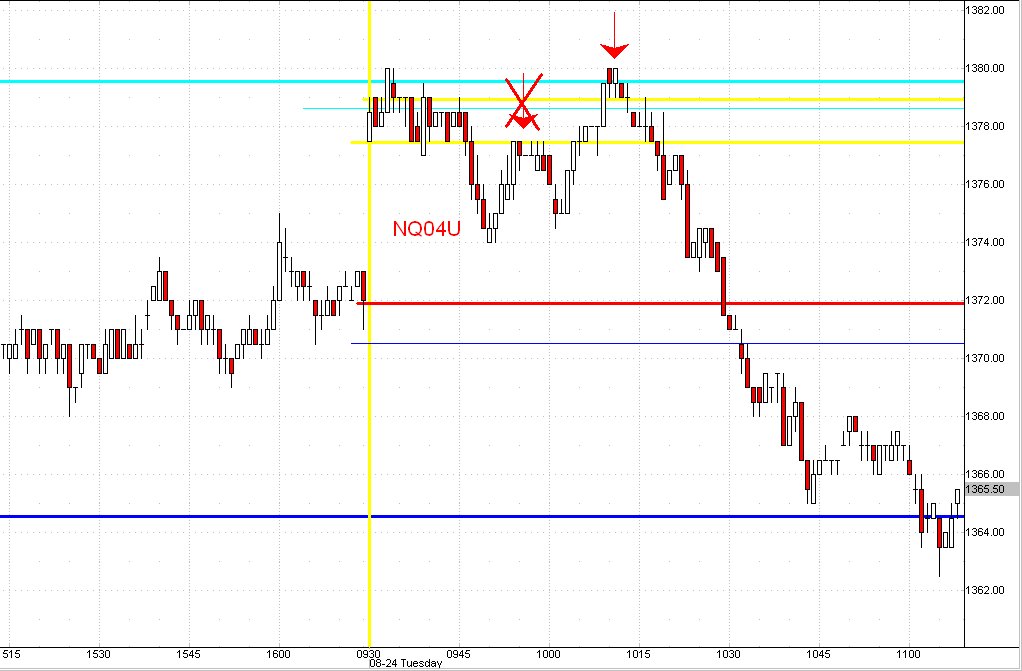
The hesitation dance step price displays before uncovering a tradeable trend is usually a confusing trick to learn--and a costly one for traders. Study the chart above (click to enlarge). Using the methodology from Pivots, Patterns and Self Recognition, there were specific rules that would have kept you out of shorting the NQ index at the first red down-arrow, and accompanying rules to get you into the short at the second and higher red arrow. If your techiques didn't position you correctly in the short NQ trade this morning, then perhaps you should consider taking our intraday swing trading course from daytradingmethods.com.

August 23, '04. Split Openings can split capital...


A lot of costly and frustrating trades can take place in a directionless market. Grant Noble, in his book The Trader's Edge, talks about the Split Opening in the grain pits as one wherein the opening price of the day is within the prior day's closing range. This often suggests that the market is in temporary balance and directionless action will follow. The same can apply to the stock index contracts, with some notable variations. Today's open just touched yesterday's closing range, and narrow action proceeded to follow well into the time of this writing at 3pm ET. The specific variations of this signal best reserved for the stock index contracts are discussed in the training course Pivots, Patterns and Self Recognition. Take the course and learn these and other capital-saving tips from daytradingmethods.com.

August 20, '04. Start the day right...


Your first trade of the day can have an encouraging or debilitating affect on the rest of your trading day. Identifying this initial trade is often very tricky. What is a trend to get on, and what is a trend about to reverse? Will the gap close, or will the price action fail? Study the chart above (click to enlarge). If your present trade methods didn't give three signals to bet short at the highs and two key signals to cover and go long at the lows, then consider taking the course Pivots, Patterns and Self Recognition. The ValhallaFutures methodologies identified these signals, and you can learn them too.

August 18, '04. ..the Measured Move...


One of the least understood and under-utilized daytrade patterns in the index futures contracts is the MidDay Channel. Conveniently written off from consideration the amorphous form of the midday doldrums, this pattern is packed with an equal move in the original trend direction if you know how it's proscribed and triggered. Measuring half way between the day's high and low, the MidDay Channel can often provide a second chance at capturing a piece of the day's original trend missed by the speed of the earlier move. To learn its elements and to recognize its format, come study the intraday swing trading course Pivots, Patterns and Self Recognition.

August 16, '04. the Technical Event Concept


There are three components that should be present for a Technical Event Concept: price level, time-of-day, and pattern fruition. When all three of these come together a tradeable swing signal is almost always at hand. On Monday, August 16, '04, all three came together nicely to call the end of one swing trend and the beginning of another. Take the course Pivots, Patterns, and Self Recognition and learn to recognize an Event Concept in time to position for intraday swing trades in the futures markets like these.

August 6, '04. Sequel...the big one that did not get away...


Sometimes trading is like fishing the day after the big one got away. First, you have to show up again. And second, you have to know what you're looking for. And if you kept one eye on the large triangle that was forming all morning today, like an eye to where the fish were biting yesterday, you just might have hooked the Sequel to yesterday's big diving fish. Learn the Prequel-Sequel and the rules to trading triangles in Pivots, Patterns and Self Recognition, available soon through daytradingmethods.com.

August 5, '04. The kiss of death...


The apex of a triangle can provide one of the best trade opportunities on the board. But few traders bother to contruct the apex on expanding triangles, also referred to as reverse symmetrical. (Click to study the chart above.) How price action reacts to a kiss of the apex can uncover the direction for the next significant trend. There are over 12 different trade setups regarding triangles in the course Pivots, Patterns and Self Recognition. Check it out at daytradingmethods.com.

August 4, '04. From the Mayoral campaign: "...and we'll even fix the potholes..."


And so does market action fix its price holes, even if it misses a few. A intraday swing trader can't afford to ignore the gapping price holes left on the bar charts, no matter newly created or long ignored. Click on the chart above to study today's action closely against that of a week ago. Price opened today filling the air space left from the week old gap, and then sold off again to close the gap completely, before an even sharper price reversal. Knowing where these price holes are each trading day is like having a road map around the downtown D.C. street terrain. Ignore them at your peril. Part of the training course for Pivots, Patterns and Self Recognition is a live, graphic chat room where these price holes are discussed each day. Come join us. Driving school is open.

August 3, '04. The right tools for the right job...


The day's first swing trend is often difficult to discern. Once that direction seems committed, traders rush to the small retracements to position for further continuance. But alas, often by the time a trend is uncovered, it's already come to an end, and for the intraday swing trader, a new one has already begun. There were two signals in the above charts that telegraphed to the observant trader that the initial bear trend exposed after the opening had,in fact, come to an end (click to enlarge). And not a single oscillator is necessary to see it. If you're trading kit doesn't have these two tools in it, then perhaps you should consider taking the course Pivots, Patterns and Self Recognition from ValhallaFutures, available at daytradingmethods.com.

August 2, '04. "What we have here is...a failure...to...communicate."


The outcome of a MidDay Period consolidation pattern is often the result of anticipation failure. This is the way the market works. It could not be otherwise so. All morning of Monday, August 1, the atmosphere surrounding the market was dripping with fear and loathing, communicating lower prices dead ahead. Police surrounding fresh terrorist targets in New York and D.C., a gap down opening bell in all indices and media talking heads reminding us of stock market reactions to past terrorist activities. Indeed, even the charts seem to be cooperating as corrections to the morning sell-offs seem only to be ready to collapse into selling again. And yet...by the end of the day the market was not selling off from the point indicated in the chart above labelled "C". Price eventually rallied sharply and finished higher after reaching the highs of the previous day. Study the concept of pattern failure in the training course Pivots, Patterns and Self Recognition, and learn to spot the true under currents to price with two little known patterns called the Dough Bar and the Fail Trigger. (The quote, in case you didn't recognize it, is from Cool Hand Luke.)